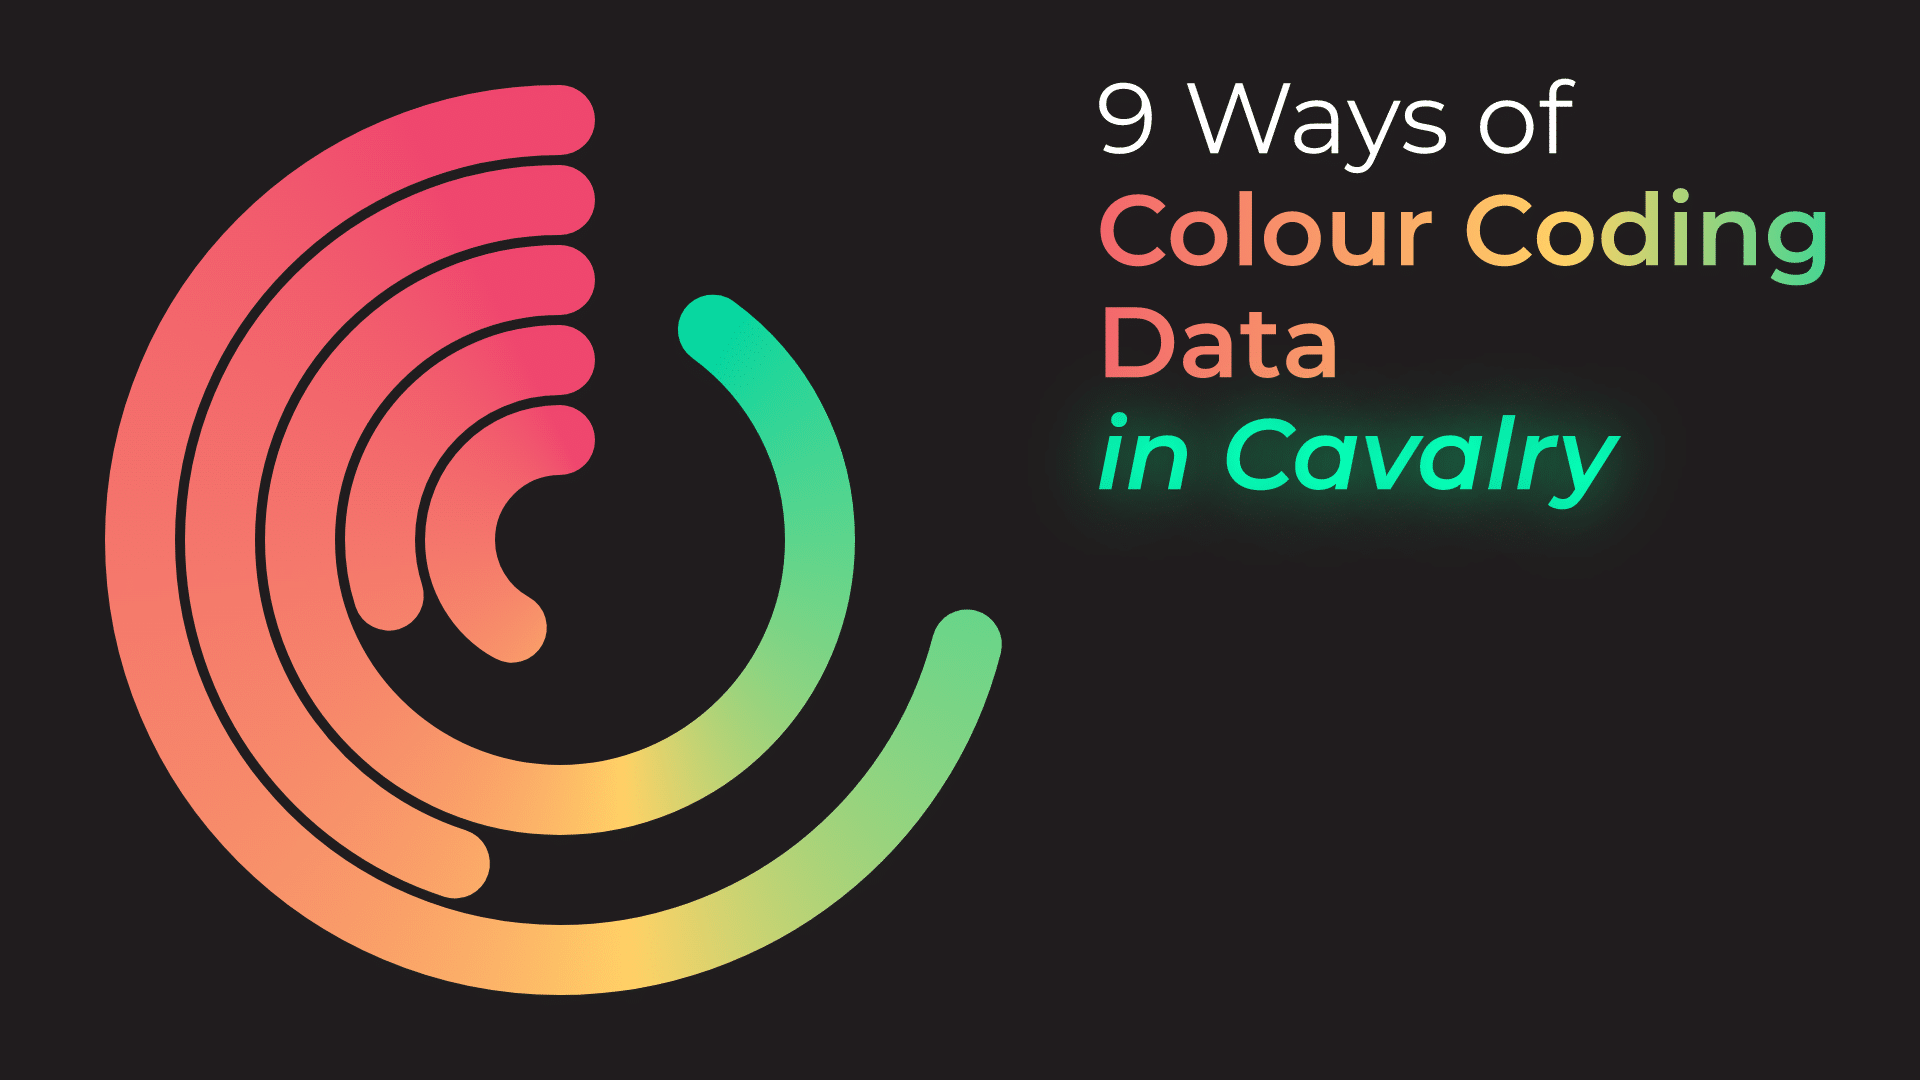
Tutorial 27: 9 Ways of Colour Coding Data in Cavalry
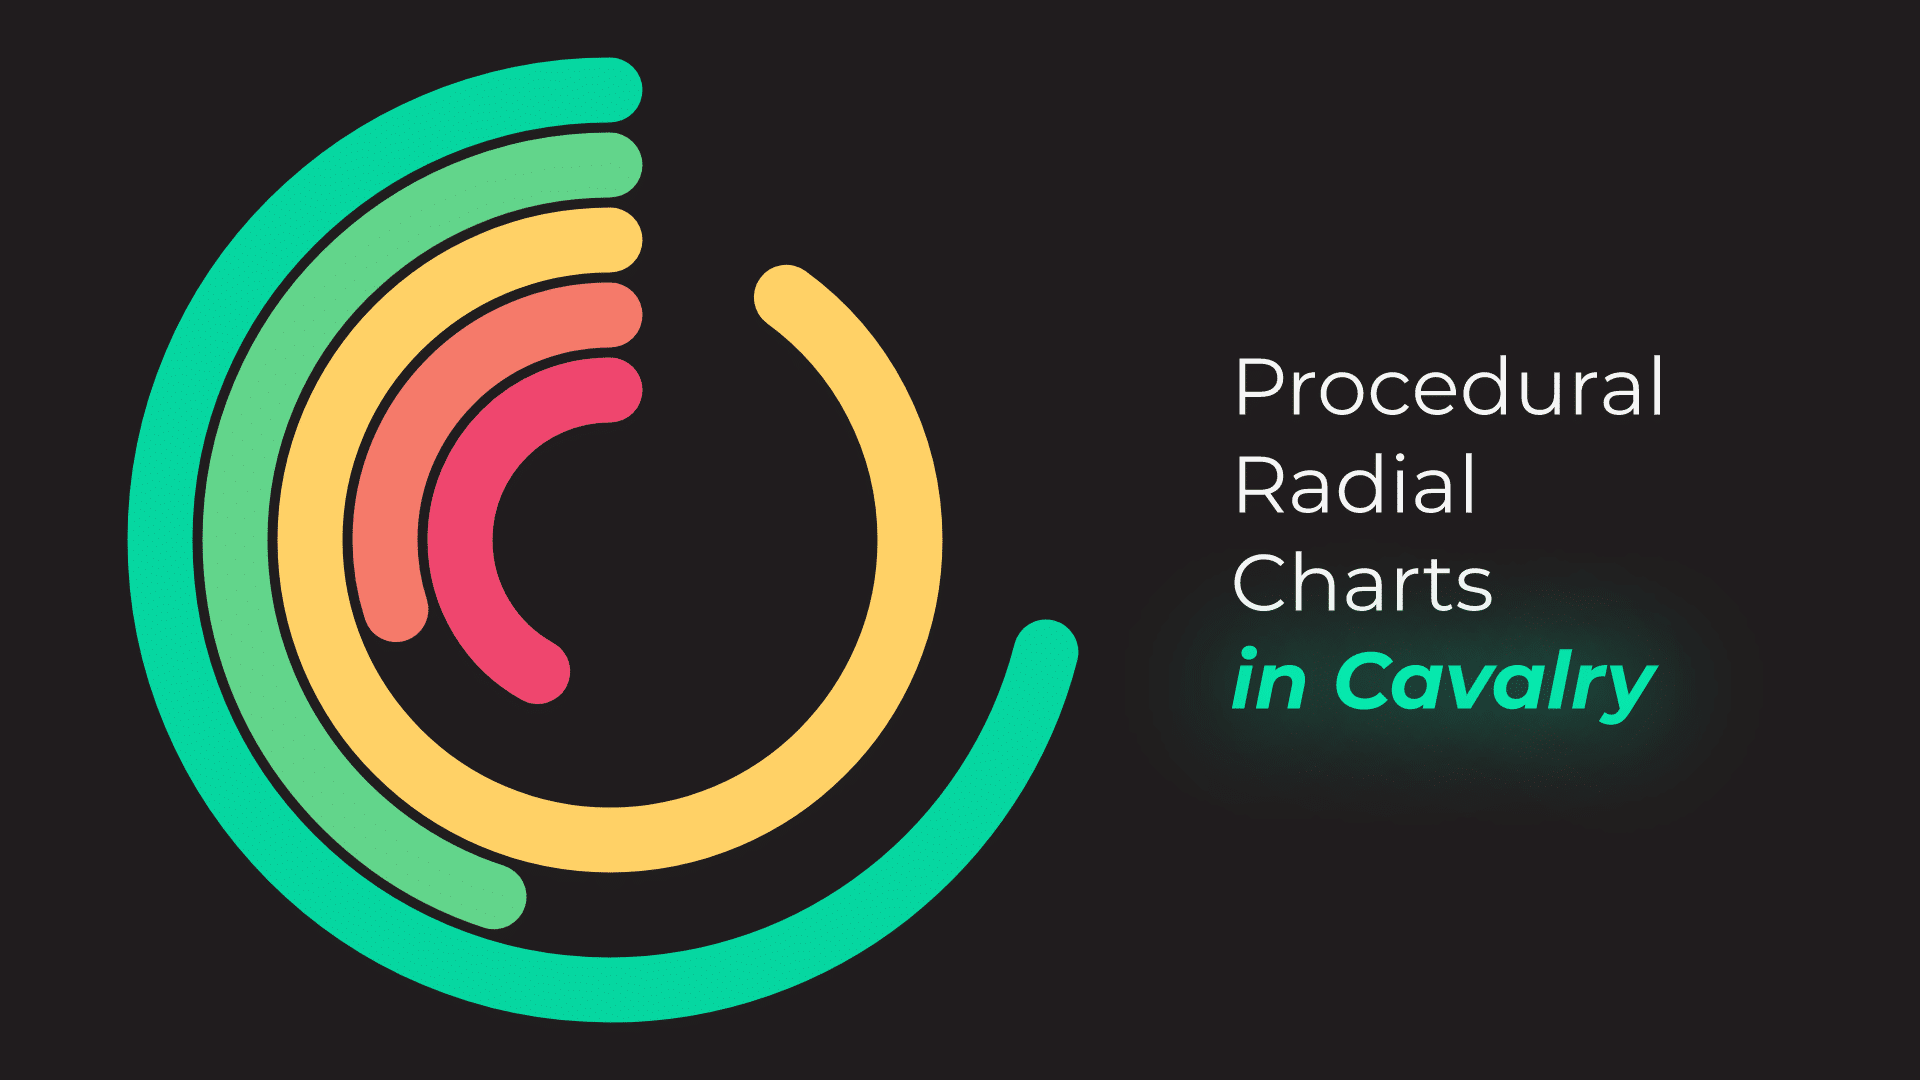
Heads up – make sure to watch the previous tutorial on creating Radial Charts in Cavalry. This way, you will understand how I created the main example.
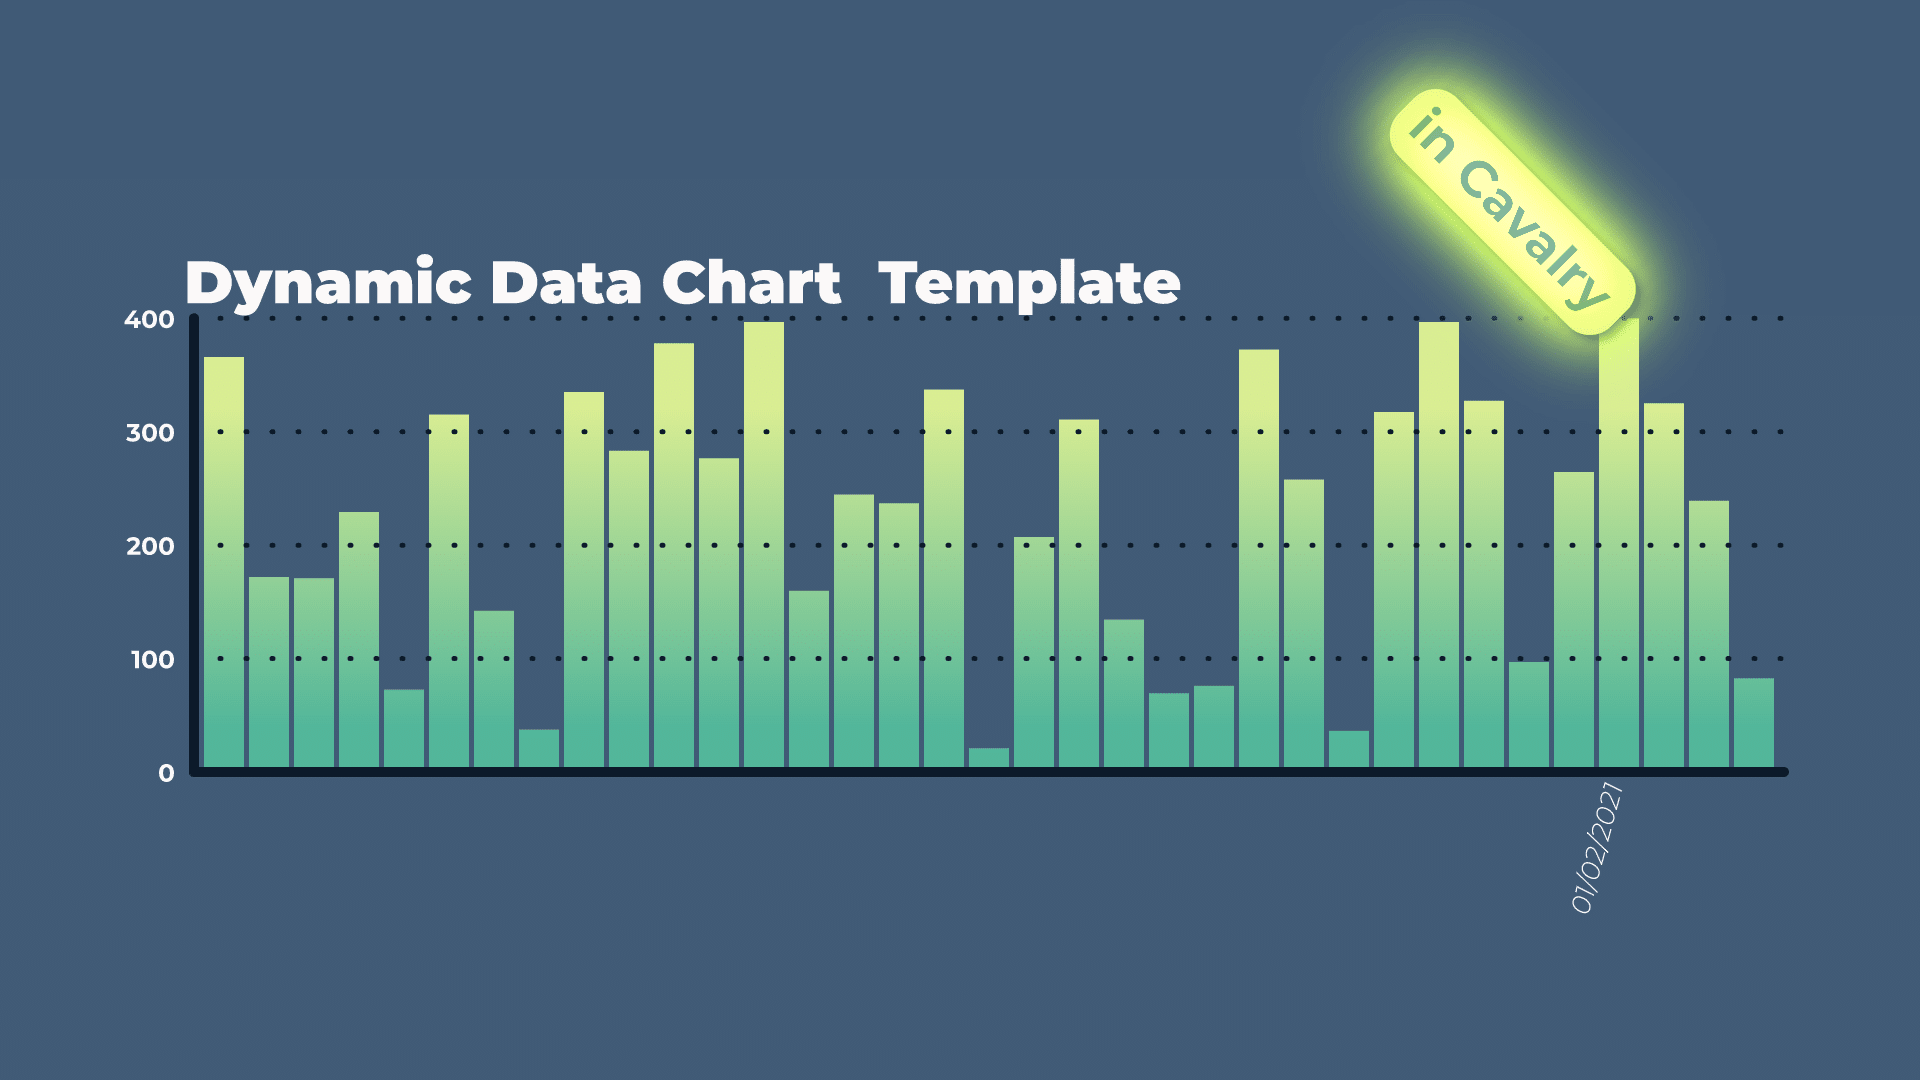
Overall, most of the techniques showed in this video, can be applied to Bar Charts as well as other charts, too. The only exception would be Gradient Stroke and Gradient Overlay. These two exceptions would require a different set up to work in a Bar Chart. I did cover it half way through, in this tutorial.
Number Range to Colour
Number Range to Colour is our workhorse. It simply converts one set of values, to 0-1 values, which are mapped to a Gradient. It is as simple as it sounds. And it is super versatile as well. It requires minimal set up and we can easily remap the colours to our liking.
Working with Data and Selecting Specific Data
When you are working with data or have access to data that creates a final design or animation, you can put it to work. You can use different tools, such as Comparison node, to create a specific “logic gate” or selection based on the underlying data.
Think of it as a “yes’ and “no” selection. If data meets your criteria, for example is HIGHER THAN specific value, then it gets assigned “positive” or “yes” selection. Otherwise, it is a “no”. You can use this information, to simply filter out data you don’t want or select a specific data in your data viz graphics.
Using Animated Data
To make data viz more dynamic and engaging, animate it. And use that animation to animate the colours as well. In most cases, you will be able to simply link Value Blend with your Number Range to Colour nodes and see immediate results. In other cases, you may have to use a different approach, such as Comparison nodes and so on.
Either way, try to think of animation and data as one and the same. One can drive the other. Data can drive the animation. And animation can drive the data. For example, animating radial chart from 0% to 100%. You can clearly see an animation on the screen. But it is driven by keyframe data. And you can use this data, to drive other things, like colour change and so on.
This project file contains all the assets necessary to make animation in the tutorial in final form. Everything is labeled, linked, with expressions and ready to use, if you wish to make your own version or just play around with it.
If you have any suggestions for tutorials or how I can improve, please do get in touch. I would love to hear from you.


