Tutorial 26: Procedural Radial Charts in Cavalry
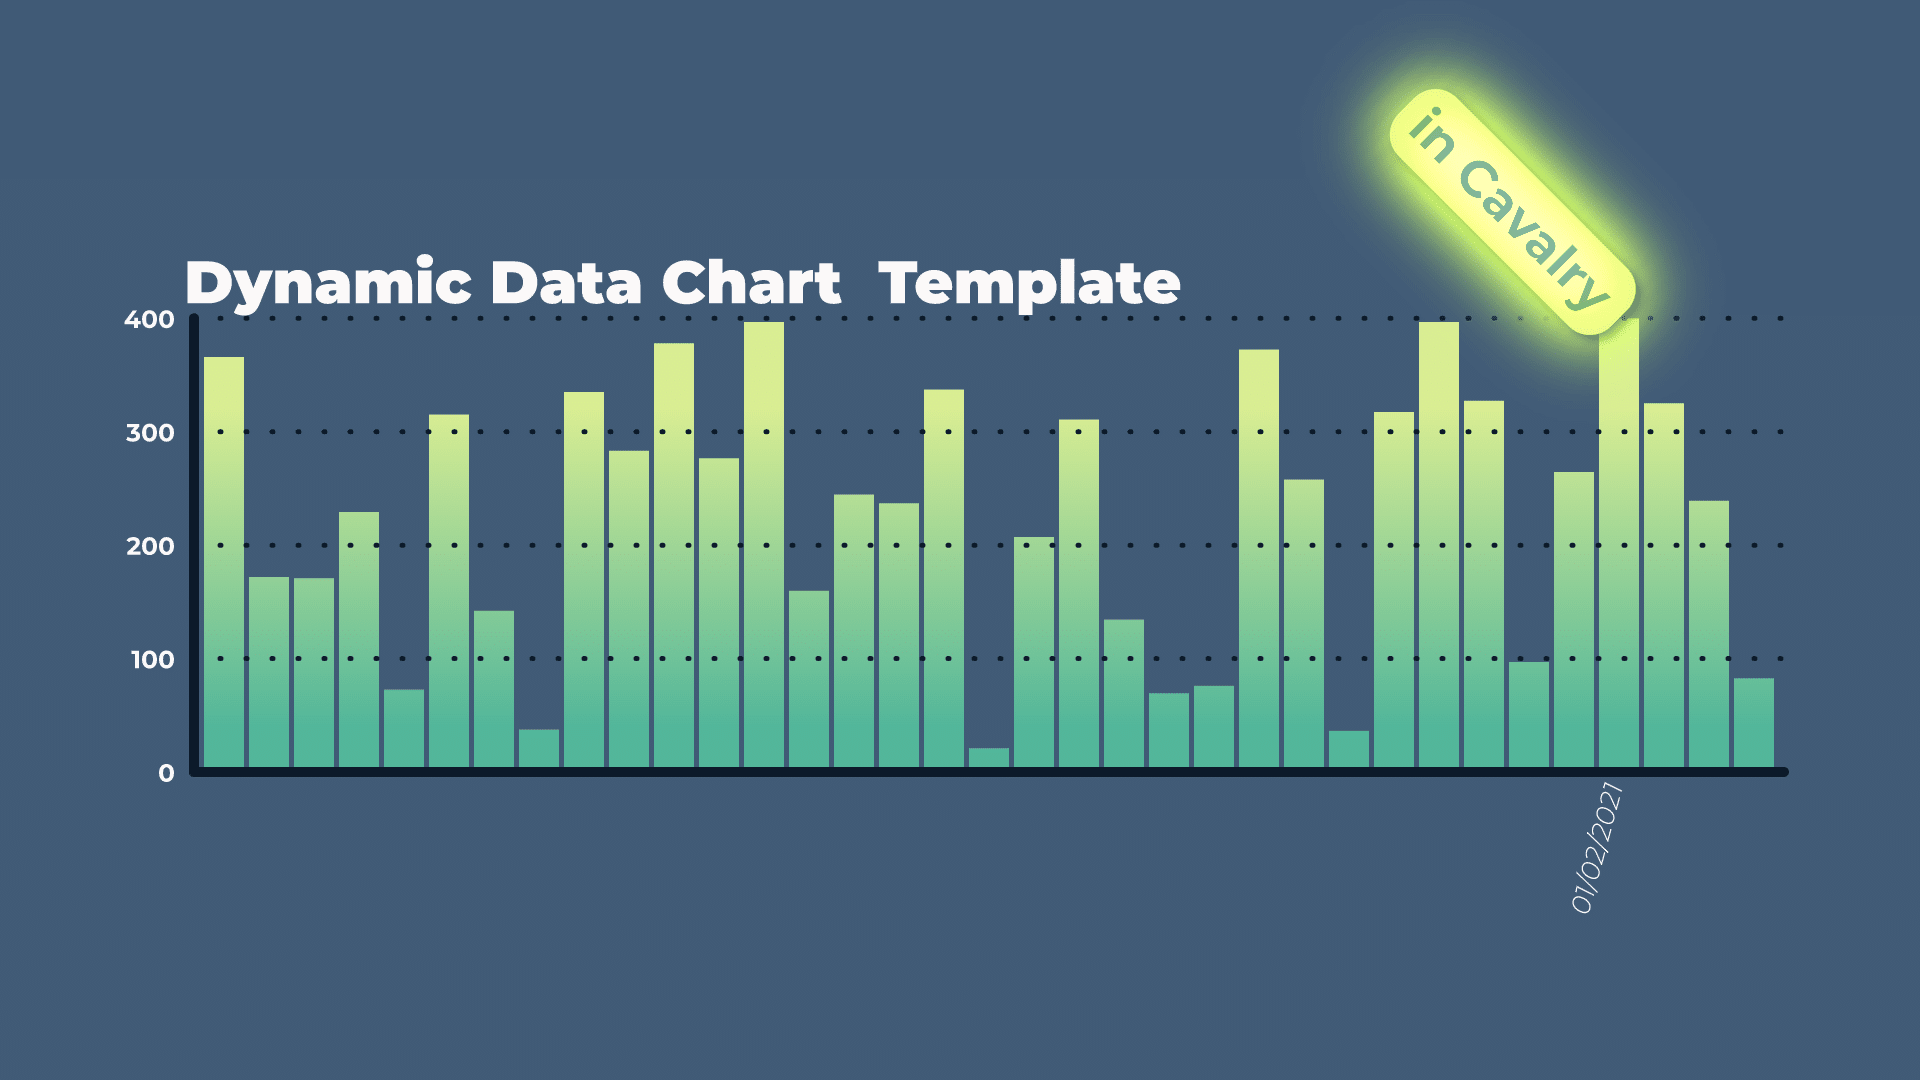
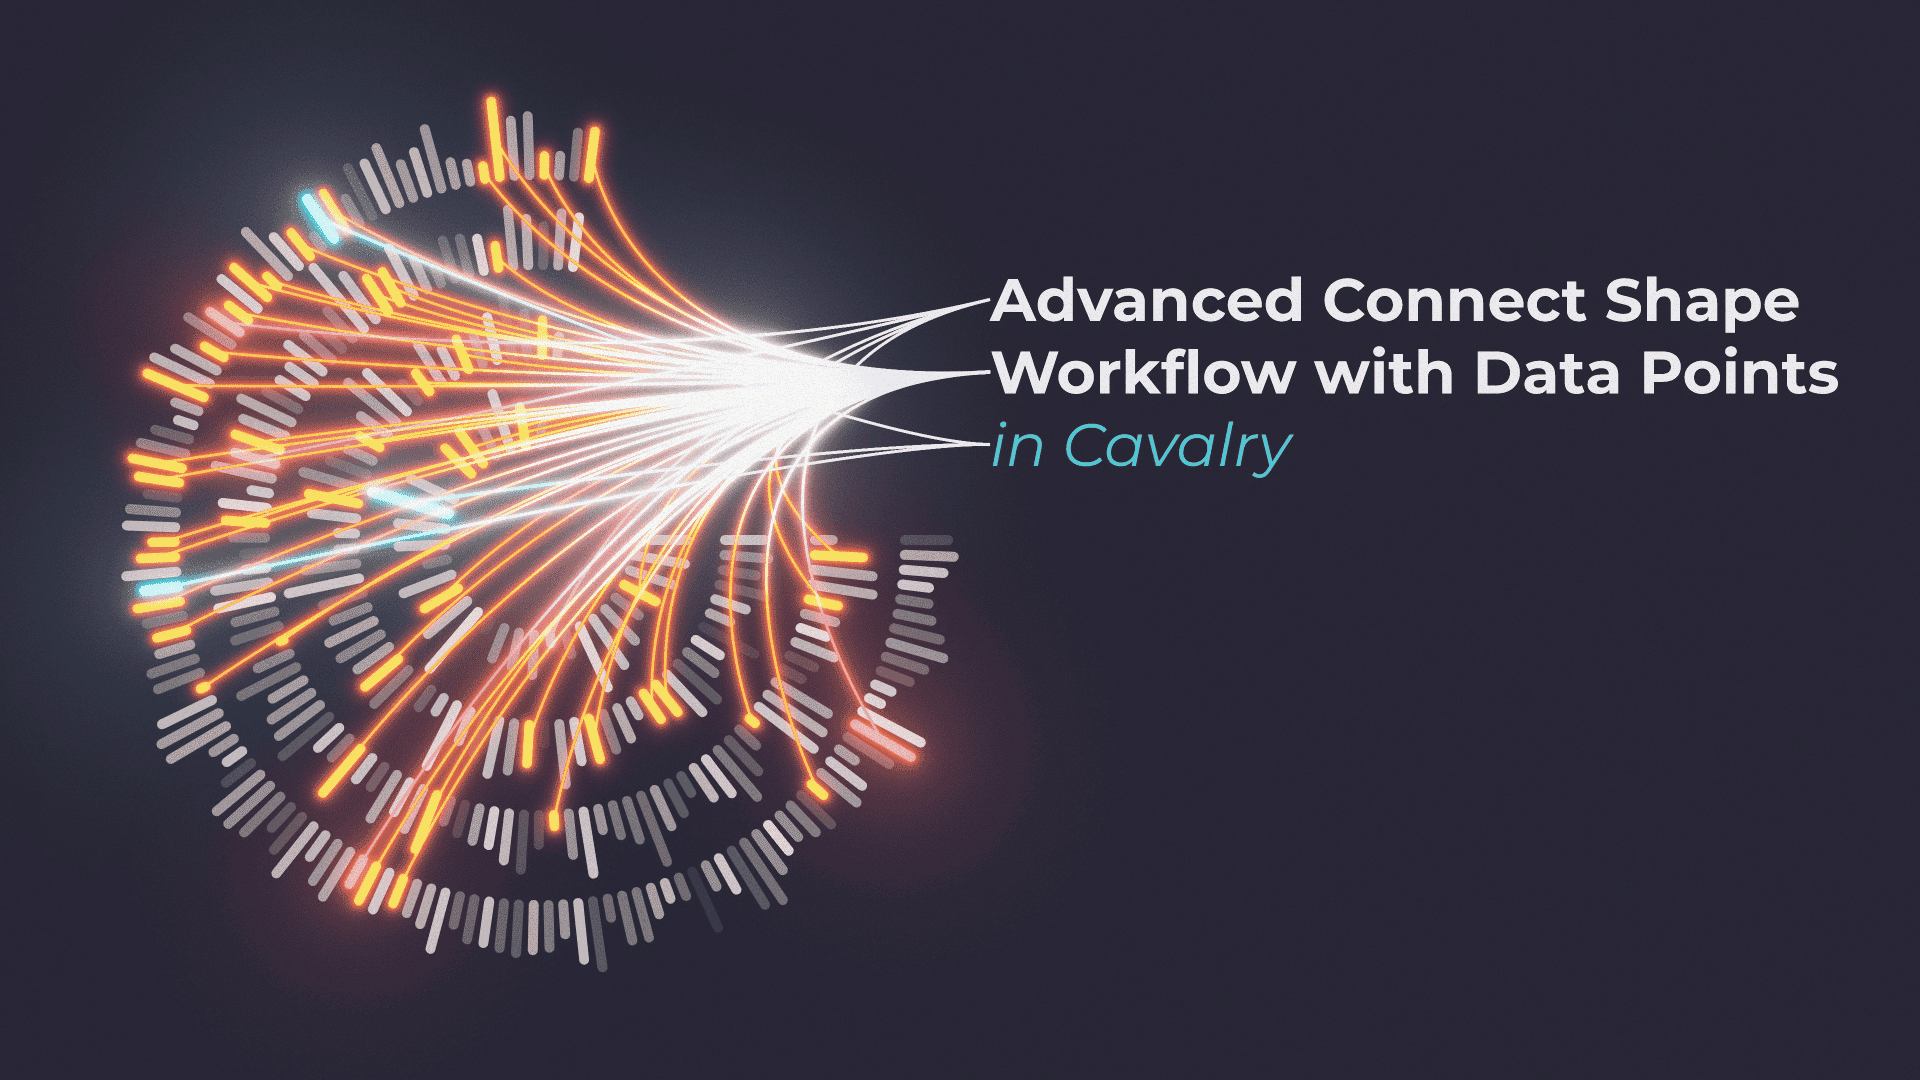
Cavalry is perfect for data viz projects. In this video, I will show you how easy it is to set up a simple Procedural Radial Chart. You can use CSV Data or Value Array to show our data in a Radial Chart.
The whole setup is very responsive and will let you create charts and animation with only 2 keyframes. By using CSV Spreadsheet, you can easily update the animation as needed, with new data.
JS Math
The whole set up is driven by a single JS Math layer. The more I use it, the more useful I find it. Essentially, it is like combining multiple Math layers, into one. By adding new Indexes to JSMath layer, we simply add extra fields, that can accept data. And then, we can simply use that data to create our own calculations.
Radius + ((Stroke Size + Gap) * Index Context)
Radius + ((Stroke Size + Gap) * Index Context) this is the whole calculation. Index Context does the most heavy lifting here. To understand it better, think of this way – every shape in a Duplicator has it’s own ID. Or an address of sorts. We use this ID to multiply each shape by it’s value.
ID = 4, then sum of Stroke and Gap is multiplied by 4.
ID = 5, then we multiply it by 5.
And so on and on. This simple concept ensures that each consecutive shape, is further and further away from the center. This ensures that there is no overlap between shapes, between strokes. The more data you have, the bigger the final Radial Chart is.
Have fun and enjoy creating Radial Charts easily 🙂
This project file contains all the assets necessary to make animation in the tutorial in final form. Everything is labeled, linked, with expressions and ready to use, if you wish to make your own version or just play around with it.
If you have any suggestions for tutorials or how I can improve, please do get in touch. I would love to hear from you.