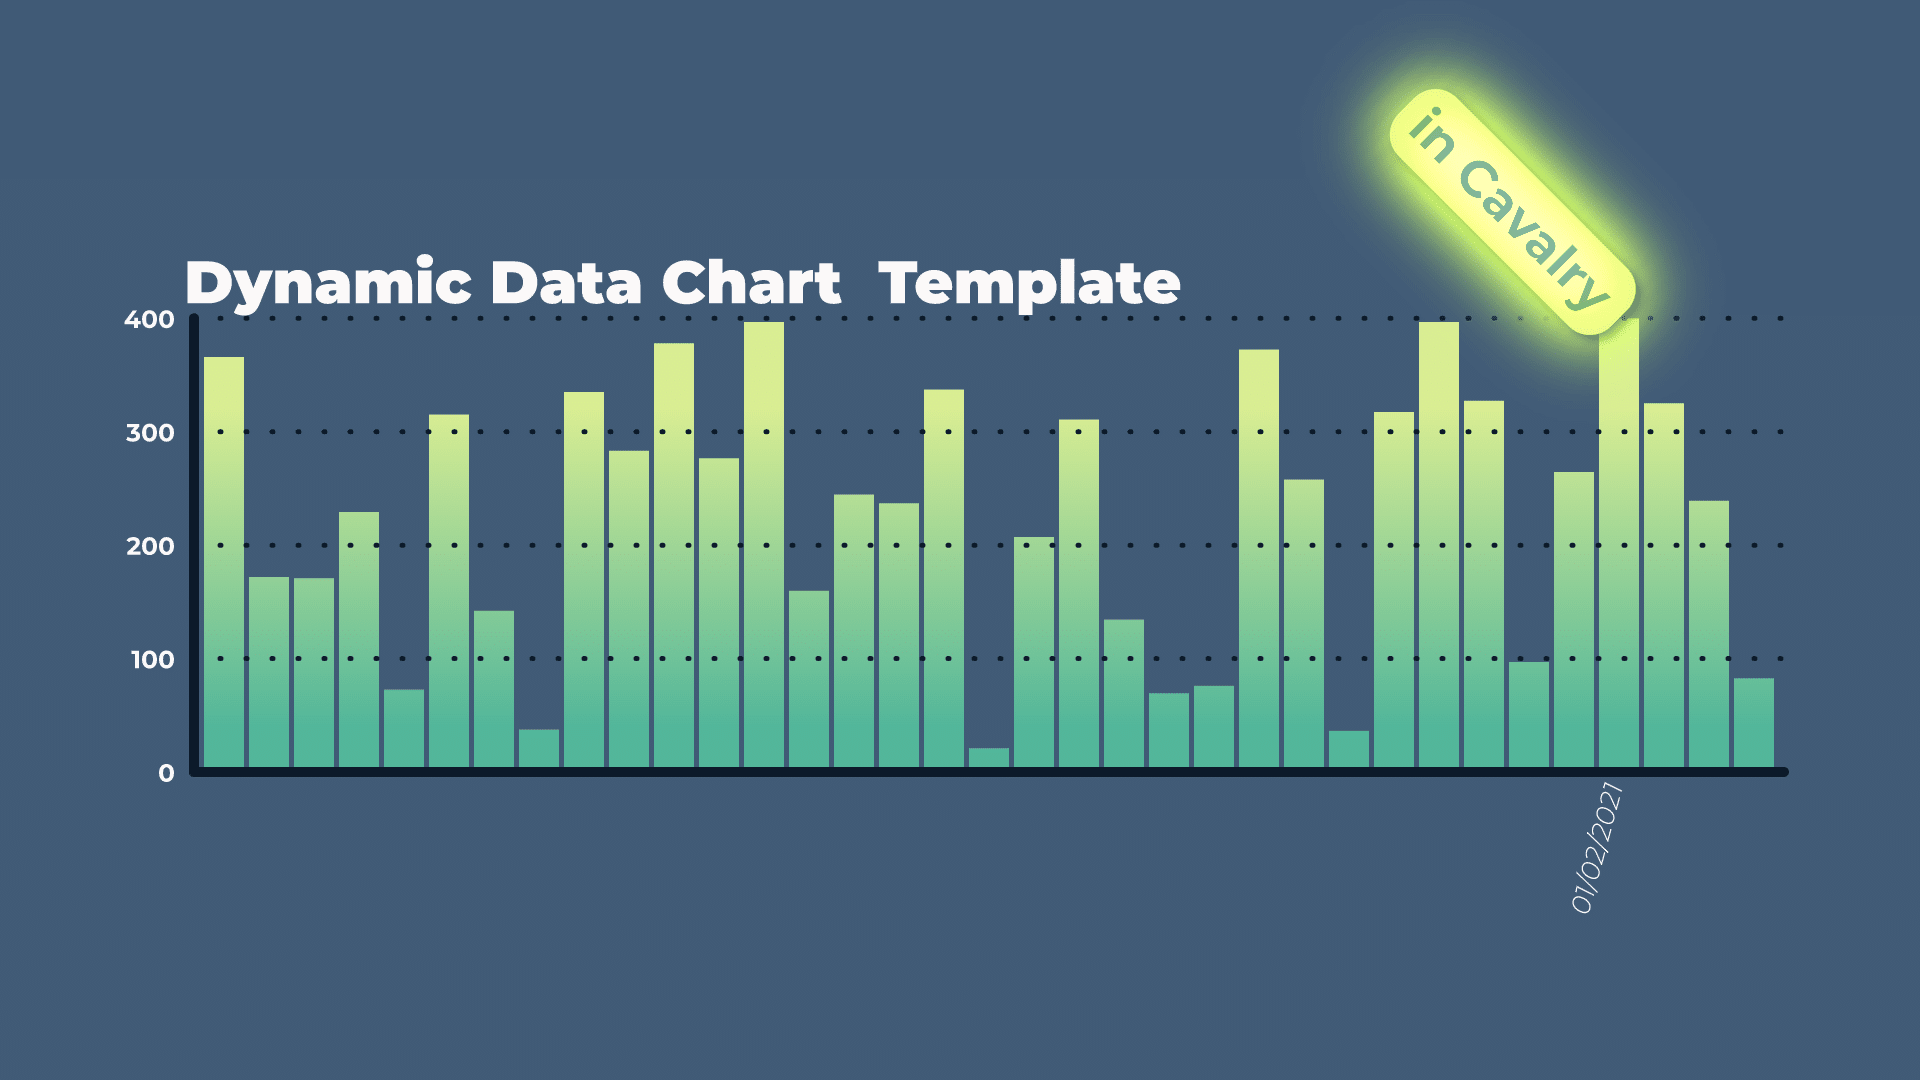
Tutorial 29: Stacked CSV Data Bar Charts in Cavalry
Cavalry makes it really easy, when you have to create a stacked bar chart. Apply Layout modifier is a way to do it. You could achieve similar result, when using Vertical or Horizontal Layout Group tool. However, this would mean that you have to update every individual element by hand / manually.
Apply Layout let’s us use CSV Data and Duplicator to quickly and easily offset shapes, based on their bounding box.
Tips and Pointers
As I mentioned in the tutorial video – use separate data, for each data bar. This way, you will be able to assign different colours and animate them one at a time, as needed. Otherwise, you will have to create more complex set ups, where you target each data block or cell, by it’s Index. Not an easy thing to do, as we are using 2 Duplicators in the above set up.
Index Context
Index Context is the key to this setup working correctly. We have to use it to “send” data from CSV to Duplicator A and finally to Duplicator B. Otherwise, as you can see in the tutorial video, nothing will show up on the screen.
What we are essentially doing is selecting each data value, for each column. And this happens for every data point – in the tutorial, I used 2 data points (Apples, Oranges, Bananas).
Number Range
When you are dealing with complex data, or data that uses values in 100s or 1000s, then you may have to remap it. Convert it from one set of units, into another. In Cavalry, we can do this directly inside CSV Spreadsheet layer. You can read about it on the Spreadsheet page here. Or, if it is easier, read about it on Number Range page – it is essentially the same concept.
This project file contains all the assets necessary to make animation in the tutorial in final form. Everything is labeled, linked, with expressions and ready to use, if you wish to make your own version or just play around with it.
If you have any suggestions for tutorials or how I can improve, please do get in touch. I would love to hear from you.